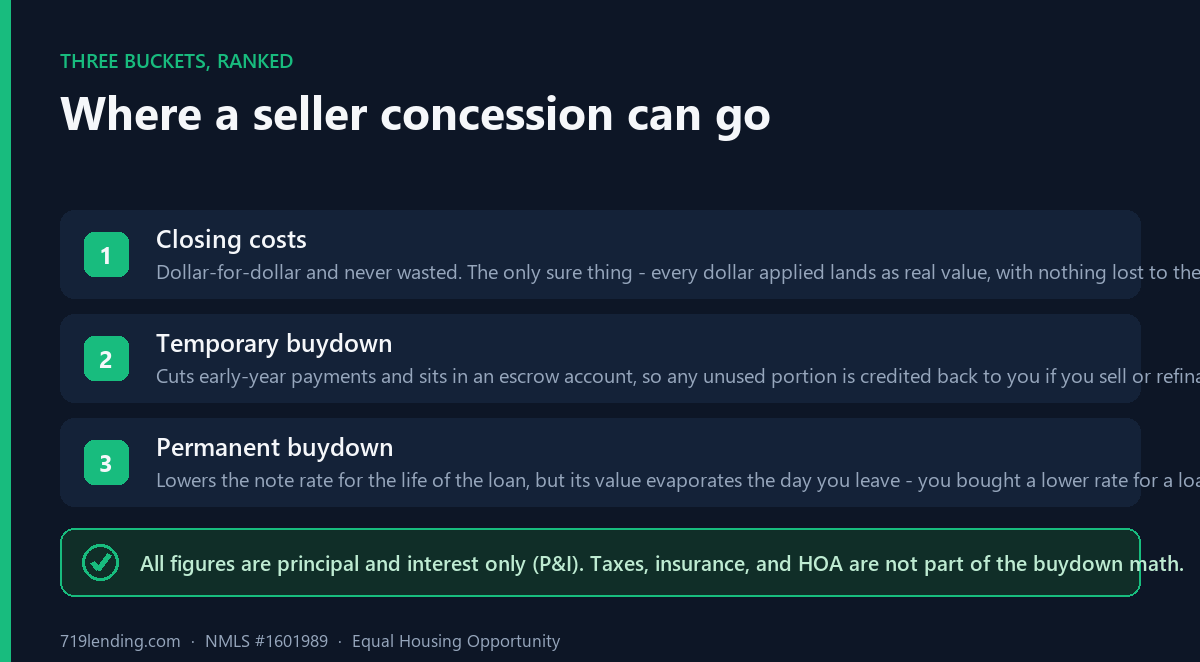
A seller concession is use-it-or-lose-it money — and the wrong split hands dollars back to the seller. The Concession Optimizer brute-forces every split across closing costs, a temporary buydown, and a permanent rate buydown to find the mix that wastes the least and nets the most over your planned stay.
Builder vs. lender: why the higher rate can make you richer
June 30, 2026
A builder offers 5.5% while your own lender wants 6.875% — so the builder wins, right? Not necessarily. A low “teaser” rate is usually funded by a higher sticker price, and on a $450k builder home vs a $400k outside quote, the higher-rate loan can leave you roughly $35,700 richer at year five. The only honest number is your net position the day you sell or refinance.
New-construction shoppers in Colorado Springs hear the same pitch on every model-home tour: use the builder’s in-house “preferred lender” and you’ll get a rate nobody else can match, plus closing-cost credits stapled on top. The rate is real. What the pitch leaves out is where that rate comes from — and who actually ends up ahead once you do the full math.
The Builder vs. Lender calculator exists to answer one question the sales office won’t: across the years you’ll actually own the home, which financing path leaves more money in your pocket? Run your numbers before you sign anything at the design center.
How can a higher rate cost less?
Because the rate is misdirection. A builder can buy down your rate cheaply — and recover that cost by pricing the house higher. You see “5.5%” and feel like you won. What you don’t see is the higher sticker price that funds it. In the tool’s default scenario that gap is $50,000.
The calculator strips the theater away. For each lender it amortizes the loan, computes monthly P&I, a true APR, your total cash out of pocket, and a net financial position — equity built minus everything you’ve paid — at the exact year you sell or refinance. Then it names a winner in dollars. On the default scenario, the builder genuinely wins on rate and on monthly payment, yet the outside lender is about $35,700 ahead at year five purely because the home cost $50,000 less. That $50,000 gap shows up as instant equity, because the calculator credits the same sale value to both paths.

What does the calculator actually compare?
Two offers, head to head: the builder’s preferred-lender quote and your own lender’s quote. You set the price, down payment, rate, and closing costs for each side, pick the term, the loan type, and how long you’ll keep the home. Here’s the default scenario the tool ships with:
| Input | Builder’s lender | Your own lender |
|---|---|---|
| Home price | $450,000 | $400,000 |
| Down payment | $0 | $0 |
| Interest rate | 5.5% | 6.875% |
| Closing costs | $10,000 | $10,000 |
| True Reg-Z APR | computed by the tool | 5.71% (example, vs a fake 4.63%) |
| Net position at year 5 | Your own lender ~$35,700 ahead | |
The numbers above are illustrative defaults, not a quote. Swap in your real builder offer and your real outside quote and the verdict can flip — which is exactly the point.
What is “net position,” and why trust it over the payment?
Net position is equity built minus everything you’ve paid out — and the calculator carries it as a signed value, so early-year negatives show up honestly instead of being hidden. In the first couple of years both paths are usually negative (closing costs and front-loaded interest haven’t been earned back yet). The verdict in those early years isn’t “which side made money” — it’s “which side is less negative.” That’s a more honest read than a glossy payment table that pretends you’re winning from month one.
This is also where two of the tool’s numbers can point in opposite directions. The verdict banner shows two separate figures: how many dollars further ahead one side is in net position, and how much lower the monthly payment is on the other. A builder loan can hand you a smaller payment every month while still leaving you behind on net worth. Both are true. Only one of them is the number that follows you to closing the day you sell.

Why does the timeline change the winner?
Because a price premium and a rate discount age differently. The calculator runs on a 1-to-30-year timeline slider, and the result updates live as you drag it.
- Shorter holds favor the cheaper price. If you sell in a few years, you never own long enough for the lower rate to claw back the extra $50,000 you paid up front. The price premium dominates.
- Longer holds tilt toward the lower rate. The more years a discounted rate compounds against the balance, the more it matters — eventually it can overtake the price gap.
That’s why the winner can flip with a single drag of the slider. There’s no universal answer; there’s only an answer for your holding period. The tool also honors the loan term everywhere in the math — a fix over legacy builder calculators that quietly amortized everything as a 30-year loan even when you chose 15 — and auto-finances FHA upfront MIP or the VA funding fee when you pick those loan types.
What’s the deal with the fake APR?
Many builder-lender calculators print an “APR” that’s really just an average-annual-cost shortcut — and it can show something absurd like 4.63% on a 6.875% note, a number that’s mathematically lower than the rate itself. That’s not how APR works.
This calculator solves a true Reg-Z APR by bisection — the same actuarial method federal disclosure rules require. On the example loan that turns the fake 4.63% into an honest 5.71%. APR exists to fold up-front costs into a single comparable rate; when a tool prints an APR below the note rate, it’s not disclosing, it’s marketing. Want to pressure-test a quoted APR on its own? The APR calculator does exactly that.
Reading the output
Once you enter both offers, the calculator returns a verdict banner (dollars ahead plus the monthly-payment gap), a per-lender breakdown of P&I, true APR, total out of pocket, equity, and net position, a year-by-year chart so you can see where the lines cross, and full amortization schedules you can export to CSV. It also handles down payment, conventional/FHA/VA loan types, and VA usage if that applies to you.
The honest takeaways line up like this:
- A builder’s low rate is often a higher price wearing a disguise.
- The winner can flip the moment you change how long you’ll stay.
- A lower payment and more net worth are different outcomes — don’t confuse them.
- The real APR is usually higher than the one builder calculators print.
None of this means the builder is the wrong choice — sometimes the builder genuinely wins, especially over a long hold or when the price gap is small. It means you should decide with the full math in front of you instead of a rate on a flyer. Try the Builder vs. Lender calculator, then bring both quotes to a Colorado Springs broker who can shop your outside option against the builder’s. You can find this and every other tool on the Calculate hub.
Calculator results are estimates for education and comparison only; your actual rate, costs, and net position depend on your full file and current market pricing.
719 Lending Inc., NMLS #1601989 · Equal Housing Opportunity · This article is educational only, is not a commitment to lend, and not all applicants will qualify. 719 Lending is not affiliated with or endorsed by any government agency.
Frequently asked questions
Is the builder's preferred lender ever the better deal? Yes — sometimes the builder genuinely wins, especially over a longer hold or when the price gap between the builder home and a comparable outside quote is small. The Builder vs. Lender calculator names the winner in dollars based on your inputs and holding period rather than assuming either side is always right.
Why does a lower rate not automatically win? Because a builder's low rate is typically funded by a higher home price. On the calculator's default scenario the builder offers 5.5% versus 6.875% and a lower monthly payment, yet the outside lender is about $35,700 ahead at year five because the home cost $50,000 less — money that shows up as instant equity. Net position, not rate, decides it.
What is the 'net position' the calculator reports? Net position is equity built minus everything you've paid, carried as a signed value so early-year negatives show honestly. In the first years both paths can be negative, so the verdict is which side is less negative. It's a truer measure of who's ahead than comparing monthly payments alone. Results are estimates.
Why does the answer change when I move the timeline slider? A price premium and a rate discount age differently. Over a short hold the cheaper price wins because the lower rate hasn't had time to claw back the extra money paid up front; over a long hold the discounted rate compounds and can overtake the price gap. The winner can flip with a single drag of the 1-to-30-year slider.
Why is the APR different from what the builder's calculator showed? Many builder calculators print a fake 'average annual cost' APR that can even read lower than the note rate — like 4.63% on a 6.875% loan. This tool solves a true Reg-Z APR by bisection, turning that fake 4.63% into an honest 5.71% on the example loan, so you compare offers on a real, disclosure-grade number.
Related Posts