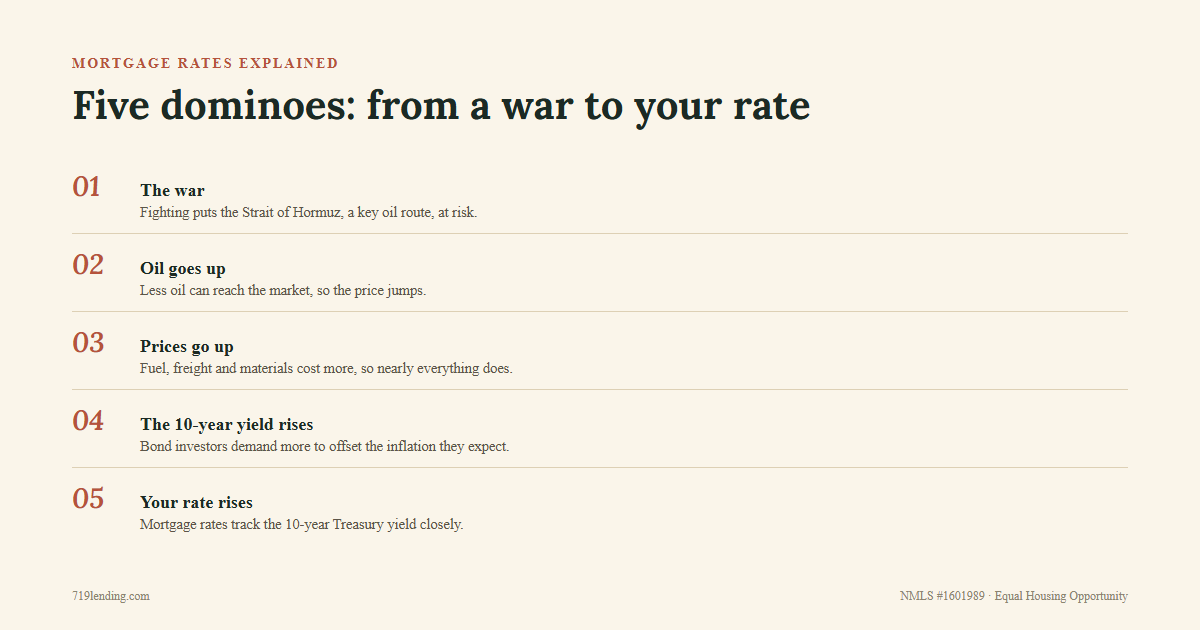
Why mortgage rates are rising: the Iran war pushed oil up, inflation fears lifted the 10-year Treasury yield, and mortgage rates followed. What to do now.
Your Price Went Up. Your Value Went Down.
The short answer: Colorado Springs home prices have barely moved in about four years — the June 2026 median sold price was $499,900, essentially flat year over year. But while the sticker stood still, the cost of nearly everything else rose 12.8%. Measured in real dollars, a home here costs about 11% less than it did at the 2022 peak. Your price went up. Your value went down — and below, we name exactly who’s winning because of it, and the one group that’s losing.
The four-year flat line
Ask anyone what Colorado Springs housing did since 2022 and you’ll hear the same word: nothing. The Pikes Peak REALTOR® Services Corp market data puts the June 2026 median sold price at $499,900 — roughly where the market peaked in mid-2022. No crash, no surge. Four years of sideways.
That flat line frustrates sellers and bores headline writers. It also hides the most interesting number in the local market.
What inflation did while the sticker stood still
A dollar in 2026 is not a 2022 dollar. Per the Bureau of Labor Statistics Consumer Price Index, cumulative inflation from June 2022 through June 2026 ran 12.8%. Groceries, insurance, cars, labor — nearly everything absorbed that increase.
Home prices here didn’t. And when the price of one big thing stands still while the price of everything else climbs, the big thing quietly gets cheaper in the only currency that matters: what your money can actually buy.
Run the math on a $500,000 example (illustrative): a home stickered at $500,000 today costs about $443,000 in June-2022 dollars — an 11.3% drop in real terms. On the actual June median, that’s roughly $57,000 of real-price relief that never showed up on a single price tag.

Who’s winning right now
Every market pays somebody. Four years of flat prices plus 12.8% inflation pays these people, in this order:
- Move-up buyers — the biggest winners. You sell at a sticker that held its number, then buy the bigger home at an 11% real discount — and the dollar gap between your house and the next one up shrank in real terms too. The trade-up math hasn’t looked this friendly since before the run-up.
- First-time buyers — clear winners versus the peak. Same sticker as 2022, about 11% less real money, no bidding wars — and per our June data, nearly half of local closings now include the seller chipping in toward the buyer’s costs.
- Long-time homeowners — still comfortably ahead. If you bought before 2020, the run-up already paid you, and a flat market doesn’t take that back. Flat prices do let inflation nibble real equity (about 3% a year at recent rates), but your cost basis keeps you far in the black — and if you trade up, you win twice.
- Sellers who are buying again — a wash. You give a little real ground on the sale and get it right back on the purchase. The only mistake is counting one side of the trade.
- The honest losers: 2022-peak buyers cashing out now. A flat sticker since the peak is roughly an 11% real-terms loss, plus selling costs. If you can hold, the math says hold; if you must sell, price to today’s market — not to 2022’s memory.
If you’re buying: your dollars stretch further than they did in 2022
Buyers in 2022 competed for homes at peak real prices — often over asking, sometimes waiving everything. A 2026 buyer pays about the same sticker for meaningfully less real money, and does it in a market where sellers negotiate. As we covered in our June seller-concessions report, nearly half of local closings now include the seller contributing money toward the buyer’s costs. Real prices down, concessions up — that combination did not exist here four years ago.
If you’re trading up: the gap just got smaller
Move-up buyers live on the spread between the home they sell and the home they buy. When the whole price ladder sits flat while incomes and everything else inflate, the real size of that spread shrinks. The jump from a $500,000 home to a $700,000 home is the same $200,000 on paper it was in 2022 — but in real purchasing power it’s about 11% less ground to cover. If the bigger house has been the plan, the arithmetic of getting there has been quietly improving. A good starting point is our Colorado Springs buyer’s guide.
If you’re selling: read this before you anchor to 2022
The honest flip side: if you bought at the 2022 peak and sell near today’s median, your equity gain on paper may be small, and in real dollars you’ve likely given some ground. That’s not a reason to panic — it’s a reason to plan the next purchase with the same math, because the home you’re moving into got cheaper in real terms too. Selling and buying in the same market largely cancels the effect; the mistake is only counting one side.
The honest caveats
- This is a price-level story, not a payment story. Monthly payments depend on mortgage rates, taxes, and insurance, which have moved on their own paths since 2022. Real-price relief does not automatically mean a lower payment — see our live Colorado Springs mortgage rates page for the current picture.
- Medians describe the market, not your house. Individual neighborhoods, price bands, and property types moved differently.
- All figures are general market data as of June 2026 — confirm current numbers before making decisions; the CPI figure updates monthly.
Frequently asked questions
Are Colorado Springs home prices dropping?
Not on paper. The median sold price has held near $500,000 for roughly four years, and June 2026 came in at $499,900, about flat year over year. Adjusted for inflation, however, real prices sit about 11% below the 2022 peak — homes have gotten cheaper relative to everything else without the sticker ever falling.
What does an inflation-adjusted home price actually mean?
It measures a home’s price against the general cost of living instead of in raw dollars. Because 12.8% cumulative inflation (BLS CPI, June 2022–June 2026) raised the price of nearly everything else while local home prices stayed flat, the same sticker price now represents a smaller share of what things cost overall — that’s the sense in which value “went down” even as the price went up.
Does this make 2026 a better time to buy in Colorado Springs than 2022?
On price alone, a 2026 buyer pays about 11% less in real terms than a 2022 peak buyer and typically negotiates seller concessions that were rare in 2022. Whether it’s the right time for you depends on your rate, payment, and plans — talk it through with a local Colorado Springs mortgage broker before deciding.
Last updated: July 20, 2026. Median price data: PPAR / RSC, June 2026. Inflation: BLS Consumer Price Index (CPI-U), June 2022–June 2026. The $500,000 example is illustrative.
719 Lending Inc., NMLS #1601989 · Equal Housing Opportunity · This article is educational only, is not a commitment to lend, and not all applicants will qualify. Figures are general market data — confirm current numbers before making decisions.

Related Posts